Flammogramm. Fire up your Cultural Transformation.
It’s easy to get enthusiastic about Kaizen or Continuous Improvement.
But how do you keep the teams active past that first peak of improvement ideas? How do you keep track of what is going on? Here’s a hands-on approach using fire, flames and flipcharts. It’s not perfect, but pragmatic.

(c) Lars Diener-Kimmich
Back in 2009 I was tasked to revive the by-then-asleep Continuous Improvement activities. That was basically a mailbox where employees could throw in their improvement ideas. The concept was that a team of specialists would then select, qualify, sharpen and implement the ideas – and eventually communicate back to the respective employee.
That rarely happened.
The specialists were working as hard as they could (next to their day job). They were struggling with internal obstacles (as most of the ideas addressed issues “somewhere” else, often in technical systems). And the originator of the idea often never heard of what happened with her/his idea, after all.
Eventually that mailbox was packed with 160 improvement ideas. But as nothing could be implemented, no one would chip in new ideas. We had to break that pattern.
Break away from Fingerpointing
We broke away from the idea that employees should “finger-point” problems in other parts of the organization, but start at their own “door step”, first. Not because they were not able to point out the problems, but because it based on a cultural value of “telling others what to do” that I didn’t like.
Also, the tendency was very clearly towards issues that were
a) big and
b) needed a technical implementation.
A typical technology-focused, big company.
Piloting bi-weekly standup meetings
We piloted bi-weekly stand-up meetings with a whiteboard with a simple structure printed on it. (Well, as you can see on the picture it was not so simple in the beginning. But we improved that along the way based on user feedback.)

(c) Lars Diener-Kimmich
The call to the teams was to convert their “fists in the pocket” into “post-it notes on that whiteboard”.
For example: Employees knew that nobody was going to need that report they had to fill out by Friday afternoon. Or, someone had realized that they were walking 1 minute each time to the printer – in a team that had to put together individual monthly bills for B2B customers.
We wanted to activate the reflex to act, to bring such small wasteful activities into “communication”. Establish a culture where you speak up and name the stupid stuff we do every day.
Being able to address them brings you an instant benefit: you win time, to be used for smarter work. And it is your or your teams’ personal win. That’s what worked.
Small is beautiful

(c) Grzegorz Gust|123rf.com
We were aware that we didn’t address the bigger issues, or improvement ideas. We dealt with them in another part of the program.
But that as well, was part of the process: to accept that we can’t have it all, but we can start small – and in large numbers! So “Small is beautiful” became our slogan and Bruno our mascot. There’s a bit more on this in my post Visualization and Storytelling. A Pig does the Trick.
The first 5 pilot teams were doing well. They kept on producing improvement ideas, and – that’s key – were also implementing many.
At that time I often had discussions with management about this “chicken shit”, small ideas that were ok. But were they actually contributing? It was a bet.
The basic idea: if you invest in a culture where employees will speak up about the improvement potential they observe in their daily work routines, there can’t be any loosers. What we didn’t know, but bet on, was the question, if over time the issues addressed would grow in size and impact. (Spoiler alert: they did! Over 3’000 ideas and 30M in benefit per year.)
Gamify to preserve the fire
Let’s go back to just after the pilot phase with these first 5 teams.
Teams next to them were starting to get interested, as they had heard.
It was talked about during coffee breaks and also the involved managers had communicated a bit about these bi-weekly standup meetings and how it works. There were great small ideas popping up that started a step-by-step shift in culture.
For example: one team found it utterly unfair, that only the boss and his secretary could book that one meeting room, and everyone else not. So, one team member brought that up in a standup meeting. The boss didn’t even know about it, was a bit ashamed and had this rectified immediately, and made that room an available resource for everyone.
It was these kinds of stories that let to a reputation of hands-on, employee-driven improvements, based on a basic value of transparency (to be allowed to speak up).
Flammogramm
After a giggly afternoon with my project team, we thought we should find a way to allow for many to see which teams were active.
We leaned on the metaphor of fire in the earliest days of civilization. It was tended to very carefully once you were able to get it going. Also, you wouldn’t throw all your fire wood on it at once to have a blasting, huge fire for one day. You wanted to preserve this source of energy over days, weeks maybe.
We wanted to preserve and maintain the fire for Continuous Improvement.
On that Friday afternoon I ended up drawing an organization chart by hand. There was no system that could plot this on one page. And then I started marking out the teams that were active – with a little flame. The “Flammogramm” was born.
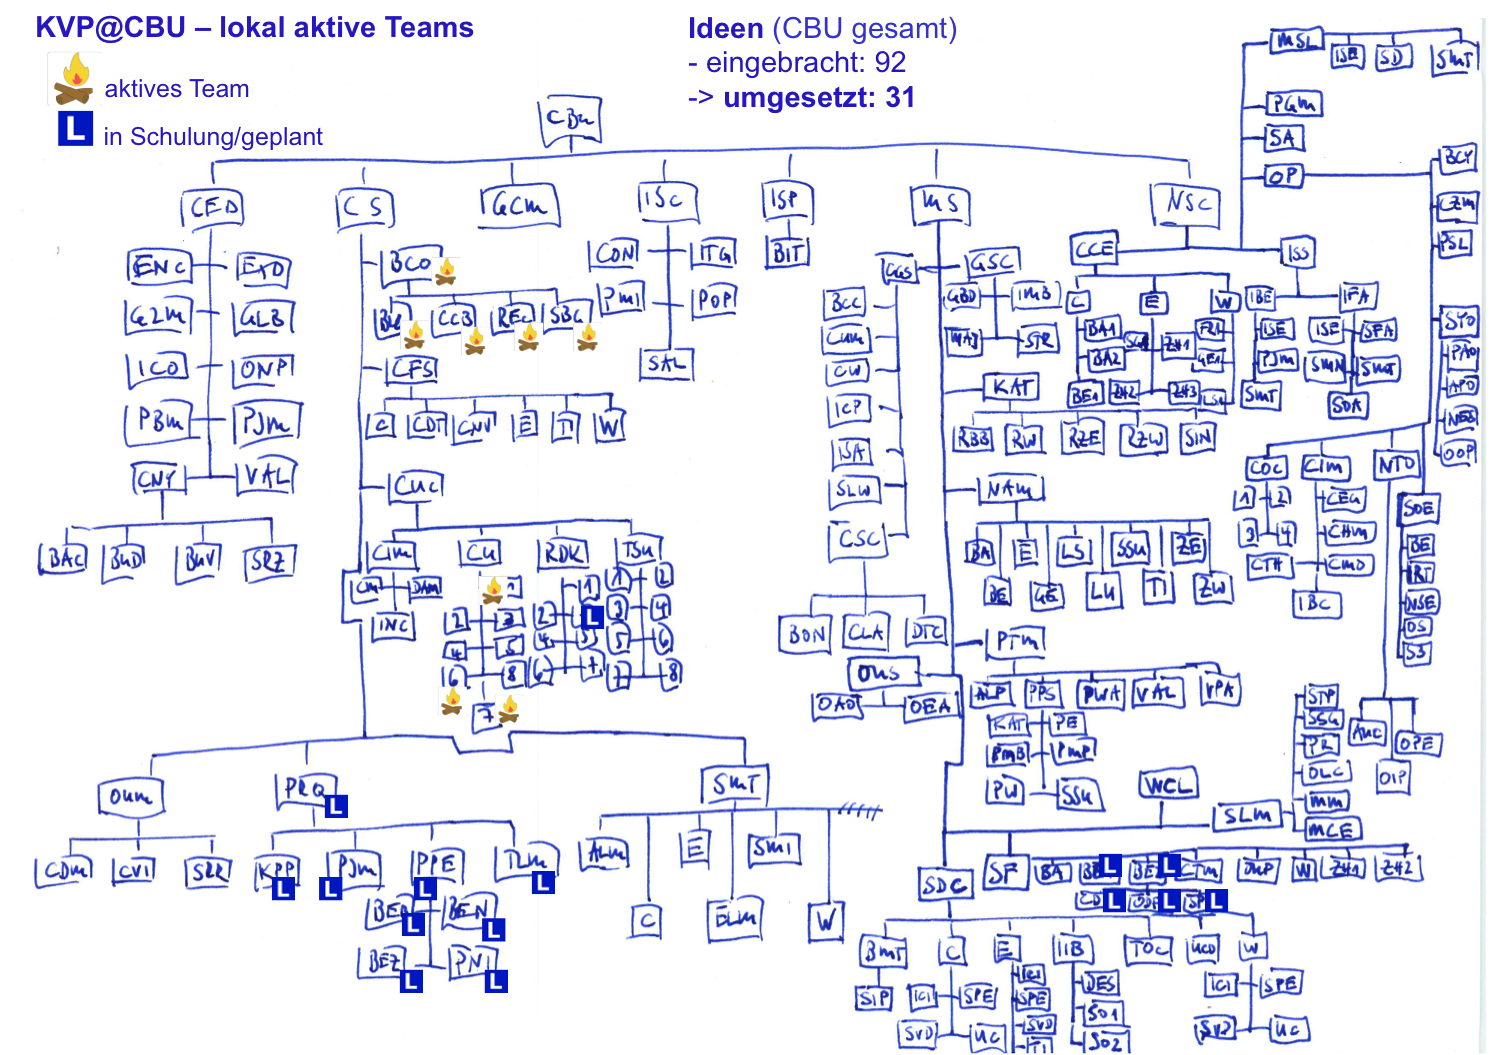
(c) Lars Diener-Kimmich
We then used it in a monthly newsletter.
Version 2 was then drawn with a tool. But still marked with flames, pragmatically by hand.
It was interesting to see what happened.
The Flammogramm allowed very simple access to see what was happening inside the company. For everyone. It was like a looking glass into a machine room.
The pioneers would find themselves alone among their peers. The late starters could find a neighbor to get them started. To share their fire. We fostered self-organisation and uncomplicated exchange among practicioners.
Reporting
We then asked the teams to “report” to us by just sending a picture of their whiteboard with the sticky notes on it. That was to both sides’ benefit:
1) The teams didn’t have any extra work. They just took a picture and we read out the 3 numbers: amount of new ideas, work in progress and implemented ideas.
2) We saw how the teams were using the whiteboard. At times we had a good reason to swing by and assist them when they were struggling. And in other situations they would use it differently and we could learn to improve the whiteboard into a better template.
Even though it was tempting, we refrained (and fought hard) to not calculate the benefit of every single implemented idea. We stuck to the credo: “If it makes sense, do it!” We were also fearing that a few big cases that would naturally be hyped up the ladder, would spoil the environment for the many, many small local improvements.
Version 4 is also mobile
The current version is also a mobile website, that allows to directly upload the picture of your whiteboard and to type in the 3 numbers by yourself. We developed it with two of our own IT apprentices, at no extra cost. A great learning project.

Example Screen at Swisscom
Also, it is integrated into our intranet and has a drill-down possibility to every team. A manager can look at the aggregated numbers in his business unit – and go compare with his peers in the board.
Again, teams that are active are marked out with a (now blue) flame. On the intranet site anyone can watch an introduction video on how to get started and use the whiteboard, and order the template to be sent directly to them.
Surviving change
Swisscom has a history of reorganizations. I’m not going to judge them.
But to establish and foster such a frail culture of small improvements is a challenge for everyone. When teams, bosses and reporting chains change, there’s always a risk that cultural routines suffer. But, also teams have realized how helpful it is – just after a reorganization – after the big pilars are set. Continuous Improvement can help build a team, move a printer and free a meeting room.
As of today over 300 teams are active. Some of the pioneers may have stopped, others have joined. We’re not forcing any team to be part of it. Well, maybe there’s strong peer pressure and in some areas attention from the top.
But to a large part it has become a cultural movement for over 5 years, now, carried by hundreds and thousands of employees throughout the organization. And the Flammogramm has been a helpful side-kick from the beginning.
Let me know how you track your Continuous Improvement activities.